Snowflake ships all Query Telemetry from an account over Data Sharing back to account and system administrators of Snowflake. I have been working with several large accounts to make a Tableau Workbook to start answering some questions on Snowflake Query History. The good news is this is a standard schema that all accounts have, so you too can leverage this workbook, make it your own, send me improvements and suggestions.
Please send Questions, Suggestions and Improvements to david[dot]spezia[at]snowflake[dot]com with the subject SnowTel

Setup to Account Usage with SnowTel Workbook
Snowflake documentation on Account Usage and Query History would be a place to start if you are new to Query History in Snowflake. By default only the ACCOUNTADMIN Role has access to query these views. I have created the workbook for ACCOUNTADMIN and using DEMO_WH. If you do not have a DEMO_WH I suggest you set one up or alter the TWB as I describe here.
I have Tableau Desktop installed and licensed on my computer. Tableau offers a 14 day trial if you want to see what this workbook looks like on your Snowflake account and you unfortunately do not have a Tableau license. Get your Tableau trial here. Snowflake ODBC drivers for Tableau are required too, see here.
How to Use the SnowTel Workbook
You can grab a copy of the workbook (TWBX) from my cloud drive linked here (or if you need the TWB because a browser will think a TWBX is a zip archive here). The workbook is version 0.3 of what I plan to make many improvements on an almost monthly basis. I have it divided into 4 dashboards for now. Warehouse Health (WH – Query Time), Warehouse Query History (WH – Queries over Time) , Queries Dashboard and Users Dashboard respectively. Two informational sheets looking at the query hierarchy and a landing page are also included.
Warehouse Health (WH – Query Time)
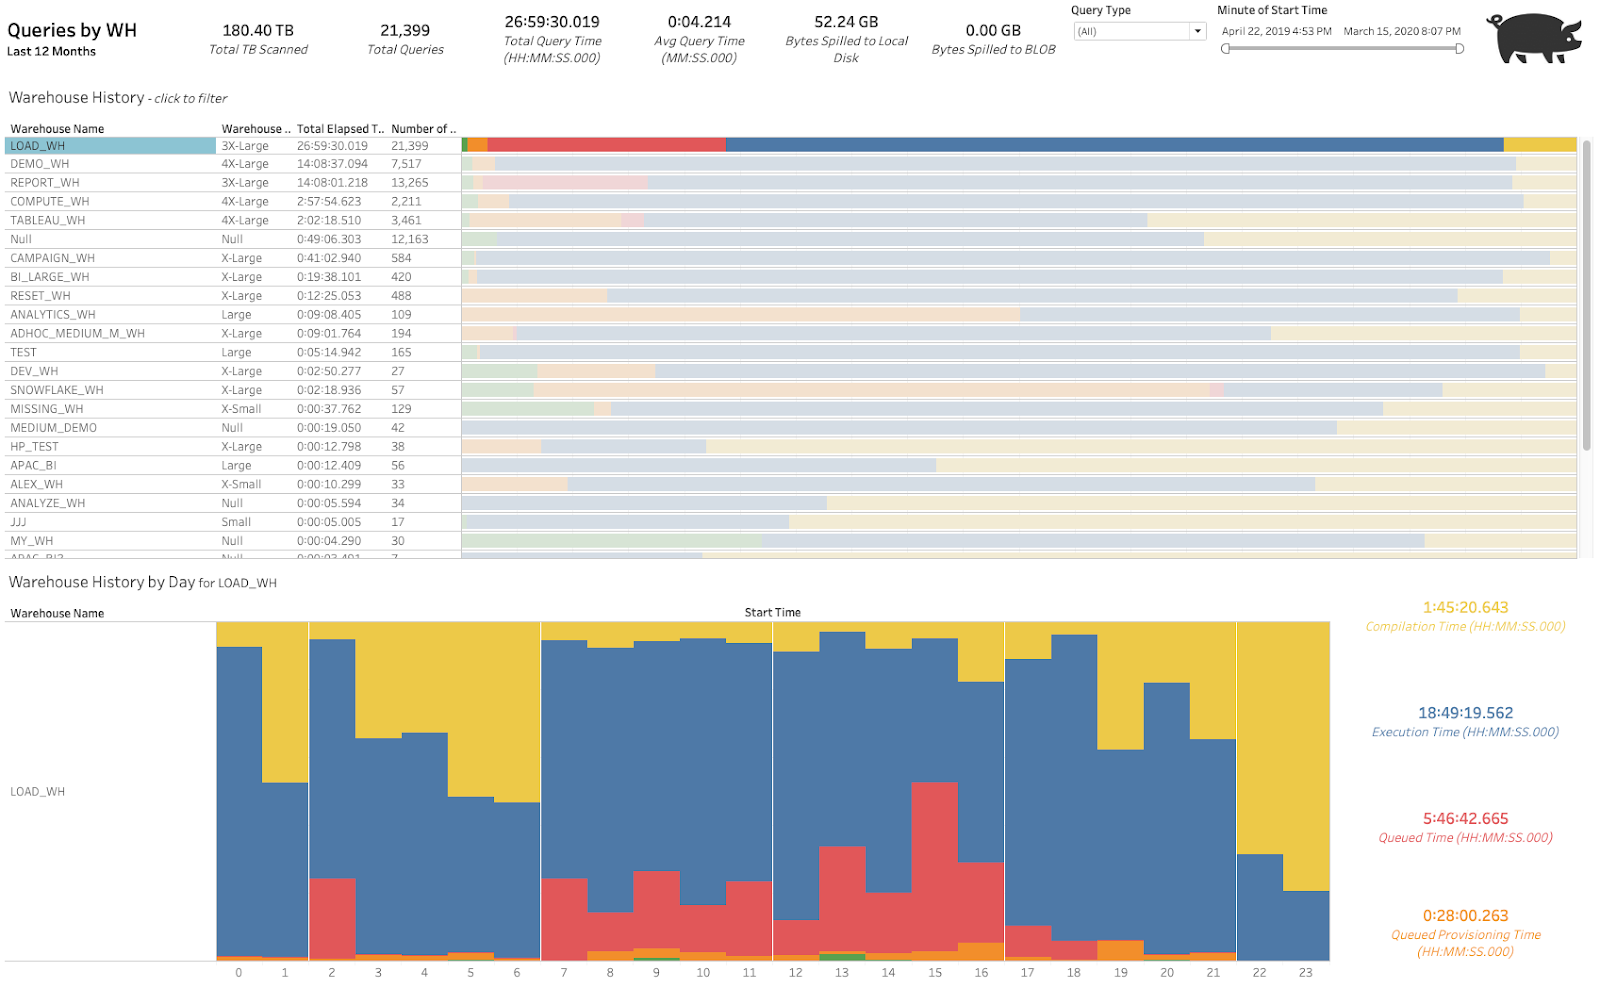
The Warehouse Health Dashboard is designed to show the average time spent doing different query operations for a warehouse cluster. The top row of metrics shows TB Scanned during query, total query count, total HH:MM:SS.000 of query time, average query bytes spilled to disk (from memory) and bytes spilled to BLOB (from disk) during query operations. The dashboard is colour coded for the operation types. Click a warehouse to get detailed operation category metrics by hour for the warehouse.
Yellow – Compilation Time is the time the query spent in the Snowflake Compiler before execution. The more complex the query the higher the number on average.
Blue – Execution Time is the time the query spent utilizing CPU, memory and data to return a result for the query.
Red – Queued Time is the waiting time a query spent in the warehouse queue, due to the warehouse being overloaded by the current query workload. If you see high percentages of this metric consider adding more clusters to the warehouse to handle concurrent workload demands. How to add more clusters to a warehouse documentation.
Orange – Queued Provisioning Time is time spent waiting for a warehouse to resume or provision to answer queries.
Warehouse Query History (WH – Queries over Time)
The Warehouse Query History Dashboard is designed to show the doing gross query operation for a warehouse cluster. The top row of metrics shows TB Scanned during query, total query count, total HH:MM:SS.000 of query time, average query bytes spilled to disk (from memory) and bytes spilled to BLOB (from disk) during query operations. The Warehouse History shows the total uptime of each warehouse. Click a warehouse for its details. Queries by Start Time shows the line chart of query volume grouped by minute of start time over time. You can multi-select a spike to get query and operation type details for the spike in activity. The Query ID by Time shows every single query for the warehouse, hover over a mark for the query text ran at that point. The Time % by Query Process breaks down the warehouse as stated in the Warehouse Health Metrics colour coding.

Queries Dashboard
The Queries Dashboard is designed to show the doing gross query operation of your account for a month. The top row of metrics shows TB Scanned during query, total query count, total HH:MM:SS.000 of query time, average query bytes spilled to disk (from memory) and bytes spilled to BLOB (from disk) during query operations. Select a Month from the filled cell chart to get gross query operations for that month. The SQL Query Text by Elapsed and Bytes can be sliced several ways by changing the slicer, by default it is SQL Query Text. The further to quadrant I the more expensive the query is on the system. Hover over a mark to get a viz in tooltip of all time that query was run and click one to filter all charts for just that query. The SQID over time shows each query ran by day and time took to run on the y axis. SQT Number & Elapsed shows the most popular queries. Queries by Start Time shows the count of queries by hour.

Users Dashboard
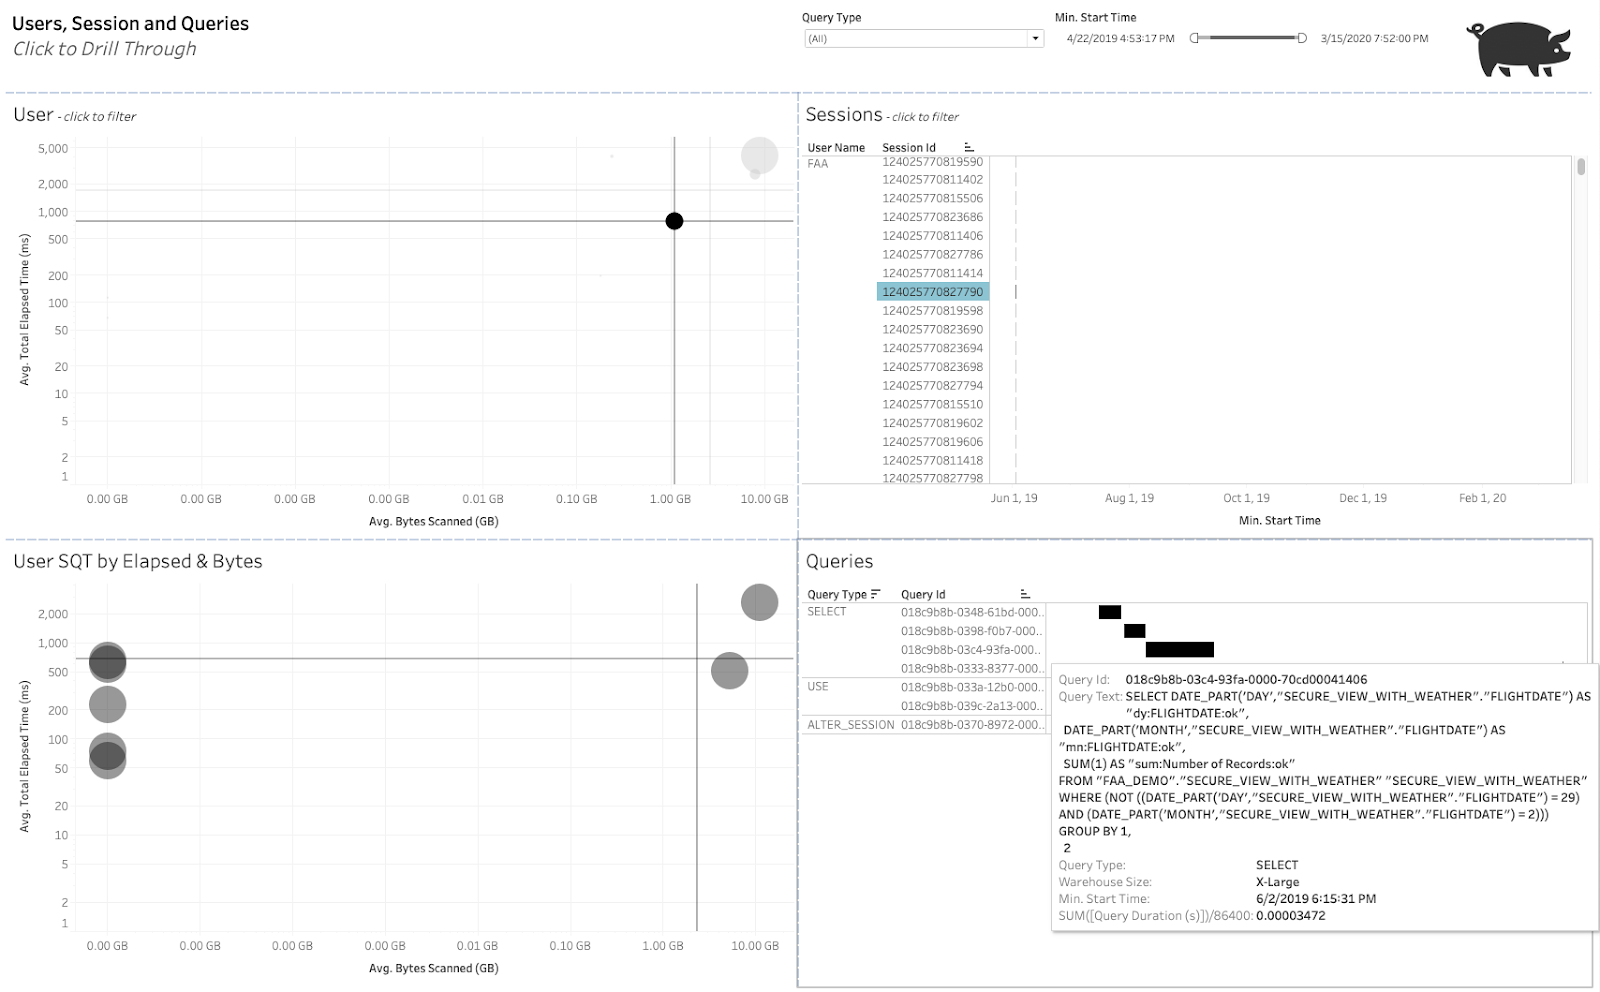
The Queries Dashboard is designed to be a full audit trail for a user. Select a User Mark from the Users chart to fill it out. The User Chart has the most expensive users in quadrant I. After clicking a user the session chart fills in to show every session for that user sorted by start time of the session. Select the user name to show all history or single session for details on just that session. The SQT and Queries will populate with queries for that session hover over a query mark to see the SQL.
Conclusion
This is the first time I have shared the workbook and it is a current work in progress. I want you to use it, abuse it and send me feedback. Please send Questions, Suggestions and Improvements to david[dot]spezia[at]snowflake[dot]com with the subject SnowTel. Happy (Query History) Querying!

Hi Big Data Dave,
I heard your session on the Snowflake Summit session and I’m trying to get some Snowflake telemetry displayed through Tableau.
When I ran it the workbook against my corporate Snowflake account, it was very slow when refreshing. Are you using an extract or a live connection? The query history table is really large.
LikeLike
I copied the objects locally to my local Snowflake account from Account usage, then ran the queries. I recommend it over using the Secure Views directly that are shared with all the Snowflake customers.
LikeLike