I often get asked for better ways to visualize or interact with task dependencies and hierarchies beyond show tasks. I was on a call with one of my favorite clients from Sunnyvale last Thursday, and we chatted through methods of using Snowsight to do this. With these SQL snippets and Snowsight charts you too should be able to better understand your tasks, their run history, and dependencies. Just in case you do not have dependant tasks yet, I have included a brief sample set of dependent tasks.
Setting the Session Context
First, if you have not already done so navigate to Snowsight to use Snowflake’s charting capabilities. How do you do this (https://docs.snowflake.com/en/user-guide/ui-snowsight-gs.html)?
--Context
use role accountadmin;
use database demo;
use schema public;
use warehouse demo_wh;

--Show all Tasks in Account
show tasks in account;

--Show all Tasks in Demo Database
show tasks;

--Create a Task Warehouse
create warehouse if not exists task_wh with warehouse_size = 'xsmall' auto_suspend = 60;
Generic Dependent Tasks if you Don’t Got One (I told him we already got one…)
This block of SQL does many things, including creating a task warehouse, a dependent set of tasks, and starts them up. Be sure to stop them after getting your feet wet as they will burn a few credits each day if left on. This generic task block will create a sample table, insert random records from Snowflake’s sample TPCDS data set, create an aggregate table, insert aggregated records from the sample run, and delete the sample run.
--Create Generic 5 Task Dependant Workflow to Work from Snowflake Sample Data
/*-------------------------------------------------------------------------------------------------------------------------
T01_CTAS
T02_INSERT_SAMPLE
T03_CTAS_AGG
T04_INSERT_AGG
T05_DELETE_SAMPLE
-------------------------------------------------------------------------------------------------------------------------*/
--Task 01 CTAS
create or replace task demo.public.t01_ctas
  warehouse = task_wh
  schedule = '15 minute'
as
  create table tbl_sample if not exists as select * from snowflake_sample_data.tpcds_sf10tcl.store_sales limit 1;
;

--Start the Task
alter task demo.public.t01_ctas resume;
--Stop the Task to Add Child Tasks
alter task demo.public.t01_ctas suspend;

--Task History
select *
from table(
  information_schema.task_history(
  scheduled_time_range_start=>dateadd('hour',-24,current_timestamp()),
  result_limit => 100,
  task_name=>'t01_ctas'));

--Task 02 INSERT SAMPLE
create or replace task demo.public.t02_insert_sample
  warehouse = task_wh
  after demo.public.t01_ctas
as
  insert into tbl_sample (select * from (select * from snowflake_sample_data.tpcds_sf10tcl.store_sales sample block (0.5)))
;

--Task 03 CTAS AGG
create or replace task demo.public.t03_ctas_agg
  warehouse = task_wh
  after demo.public.t02_insert_sample
as
  create table tbl_sample_agg if not exists as
      select d_date,
      sum(ss_quantity) as sum_ss_quantity,
      sum(ss_ext_sales_price) as sum_ss_ext_sales_price
      from tbl_sample ts
      join snowflake_sample_data.tpcds_sf10tcl.date_dim dd on ts.ss_sold_date_sk = dd.d_date_sk
      group by d_date
      order by d_date desc;
;

--Task 04 INSERT AGG
create or replace task demo.public.t04_insert_agg
  warehouse = task_wh
  after demo.public.t03_ctas_agg
as
  insert into tbl_sample_agg (
      select d_date,
      sum(ss_quantity) as sum_ss_quantity,
      sum(ss_ext_sales_price) as sum_ss_ext_sales_price
      from tbl_sample ts
      join snowflake_sample_data.tpcds_sf10tcl.date_dim dd on ts.ss_sold_date_sk = dd.d_date_sk
      group by d_date
      order by d_date desc)
;

--Task 05 DELETE SAMPLE
create or replace task demo.public.t05_delete_sample
  warehouse = task_wh
  after demo.public.t04_insert_agg
as
  delete from tbl_sample
;

--Start the Task Group
alter task demo.public.t05_delete_sample resume;
alter task demo.public.t04_insert_agg resume;
alter task demo.public.t03_ctas_agg resume;
alter task demo.public.t02_insert_sample resume;
alter task demo.public.t01_ctas resume;

--Depedencies
show tasks;
select "name", "id", "state", "predecessors" from table(result_scan(last_query_id()));
Now we need to start unwinding and iterating on the ‘Show Tasks;’ command to pull out a proper tree of dependencies.

Task History
Snowflake has a packaged information_schema function to pull out task run history, we will come back to this to pull out run status and timing later in the article.
--Full Task History
(select *
from table(
  information_schema.task_history(
  scheduled_time_range_start=>dateadd('hour',-24,current_timestamp()),
  result_limit => 100,
  task_name=>'t01_ctas')))
union
(select *
from table(
  information_schema.task_history(
  scheduled_time_range_start=>dateadd('hour',-24,current_timestamp()),
  result_limit => 100,
  task_name=>'t02_insert_sample')))
union
(select *
from table(
  information_schema.task_history(
  scheduled_time_range_start=>dateadd('hour',-24,current_timestamp()),
  result_limit => 100,
  task_name=>'t03_ctas_agg')))
union
(select *
from table(
  information_schema.task_history(
  scheduled_time_range_start=>dateadd('hour',-24,current_timestamp()),
  result_limit => 100,
  task_name=>'t04_insert_agg')))
union
(select *
from table(
  information_schema.task_history(
  scheduled_time_range_start=>dateadd('hour',-24,current_timestamp()),
  result_limit => 100,
  task_name=>'t05_delete_sample')));

Visualizing Tasks Explicit Task Trees with CONNECT BY and SYS_CONNECT_BY_PATH
I am going to use an old favorite function I built back in February that takes the SHOW command and creates and persists a JSON table from the output https://bigdatadave.com/2020/02/17/snowflake-update-select-show-object-to-json/.
--Add in STORE_GET_SHOW2()
CREATE OR REPLACE PROCEDURE STORE_GET_SHOW2 (OBJECT STRING)
    RETURNS STRING
    LANGUAGE JAVASCRIPT
    EXECUTE AS CALLER
    AS
    $$
    try {
      //First call the show command for the input object
      var sqlcmd = `SHOW ` + OBJECT + `;`
      var stmt = snowflake.createStatement( { sqlText: sqlcmd } );
      stmt.execute();

      //Now create a table with the input Objects name, no spaces
      var sqlcmd = `CREATE OR REPLACE TABLE ` + OBJECT.replace(" ","_") + `_TABLE (V VARIANT);`;
      var stmt1 = snowflake.createStatement( { sqlText: sqlcmd } );
      stmt1.execute();

      //Beautiful line of SQL that inserts the data as JSON into our input Object table while transforming the JSON payload into one record per record in the Show Command.
      var sqlcmd = `INSERT INTO ` + OBJECT.replace(" ","_") + `_TABLE (SELECT OBJECT_CONSTRUCT(*) FROM TABLE(RESULT_SCAN('` + stmt.getQueryId() + `')));`;
      var stmt2 = snowflake.createStatement( { sqlText: sqlcmd } );
      stmt2.execute();
    // Return a success/error indicator
    return "Succeeded.";
    }

    catch (err)  {
      // Return a success/error indicator.
      return "Failed: " + err;
    }
    $$;

--Testing
CALL STORE_GET_SHOW2('TABLES');
SELECT * FROM TABLES_TABLE;
Using this STORE_GET_SHOW2() and CONNECT BY with a SYS_CONNECT_BY_PATH() we can create a tree for an explicit path. This works fine if you want to look at tasks one at a time, we will build the dynamic function next.
--Call Get Show 2 with Tasks
call store_get_show2('tasks');
select v::variant from tasks_table;

--Query to Visualize Dependencies Explicit
select *, sys_connect_by_path (path, '->') as dependency_tree , level
from (select v:name::string as name, v:schedule::string as schedule, v:predecessors::string as predecessor,
     v:database_name::string || '.' || v:schema_name::string || '.' || v:name::string as path
     from demo.public.tasks_table)

Results in this clean hierarchy for the deepest nested task: ->DEMO.PUBLIC.T01_CTAS->DEMO.PUBLIC.T02_INSERT_SAMPLE->DEMO.PUBLIC.T03_CTAS_AGG->DEMO.PUBLIC.T04_INSERT_AGG->DEMO.PUBLIC.T05_DELETE_SAMPLE
We can even view it as a heat grid to see a visual of the dependencies by level.

Pfft…it’s Only Cool if it’s Dynamic
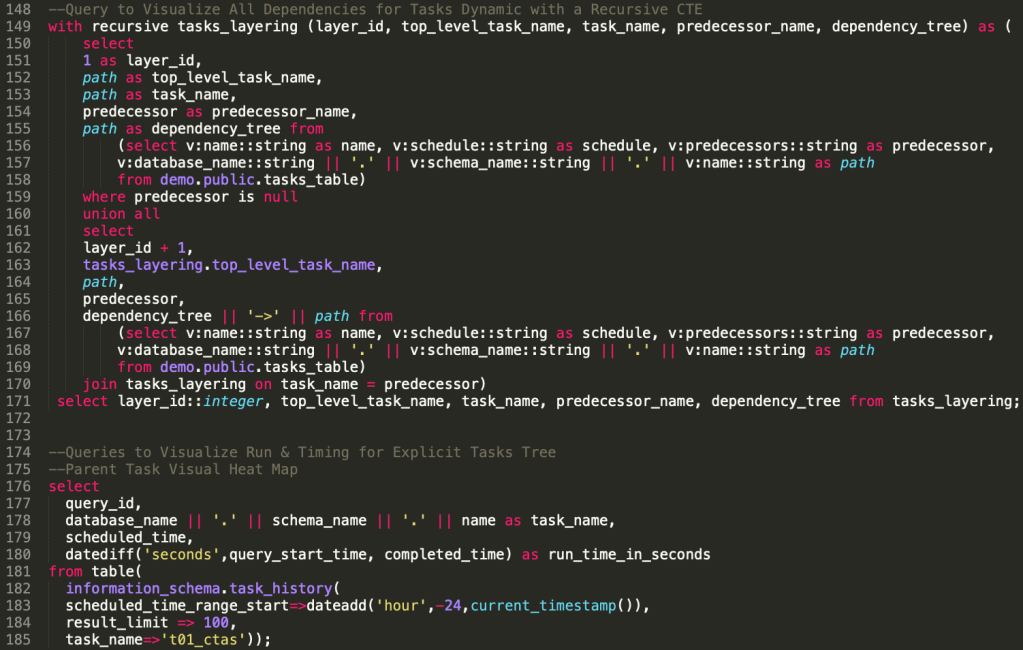
Alright, time to break out the big dog SQL; Recursive Common Table Expressions. We can create layer IDs, a top-level task, and task dependency trees for all tasks in the database. We can assume every task without a predecessor is a top-level task, and recursively visit all the subtasks until we build out the full tree. I gotta be honest when it worked the first time I did a little SQL Shuffle at my desk.
--Query to Visualize All Dependencies for Tasks Dynamic with a Recursive CTE
with recursive tasks_layering (layer_id, top_level_task_name, task_name, predecessor_name, dependency_tree) as (
    select
    1 as layer_id,
    path as top_level_task_name,
    path as task_name,
    predecessor as predecessor_name,
    path as dependency_tree from
        (select v:name::string as name, v:schedule::string as schedule, v:predecessors::string as predecessor,
        v:database_name::string || '.' || v:schema_name::string || '.' || v:name::string as path
        from demo.public.tasks_table)
    where predecessor is null
    union all
    select
    layer_id + 1,
    tasks_layering.top_level_task_name,
    path,
    predecessor,
    dependency_tree || '->' || path from
        (select v:name::string as name, v:schedule::string as schedule, v:predecessors::string as predecessor,
        v:database_name::string || '.' || v:schema_name::string || '.' || v:name::string as path
        from demo.public.tasks_table)
    join tasks_layering on task_name = predecessor)
 select layer_id::integer, top_level_task_name, task_name, predecessor_name, dependency_tree from tasks_layering;

Let’s Visualize Task Run History
We can use the information_schema.task_history function for each of the tasks in the tree. It’s hard coded in this version. We could create a recursive CTE to grab these from the show tasks, but you only get 1 per blog post of those. I have found using the Bar Chart to be the way to go in Snowsight, unless you have Tableau and proper Gantt charts.
--Queries to Visualize Run & Timing for Explicit Tasks Tree
--Parent Task Visual Heat Map
select
  query_id,
  database_name || '.' || schema_name || '.' || name as task_name,
  scheduled_time,
  datediff('seconds',query_start_time, completed_time) as run_time_in_seconds
from table(
  information_schema.task_history(
  scheduled_time_range_start=>dateadd('hour',-24,current_timestamp()),
  result_limit => 100,
  task_name=>'t01_ctas'));


--Full Task Run History
select
  'task t01_ctas to t05_delete sample' as task_name,
  root_task_id,
  run_id,
  min(scheduled_time) as start_time,
  datediff('seconds',min(query_start_time), max(completed_time)) as run_time_in_seconds
from
((select *
from table(
  information_schema.task_history(
  scheduled_time_range_start=>dateadd('hour',-24,current_timestamp()),
  result_limit => 100,
  task_name=>'t01_ctas')))
union
(select *
from table(
  information_schema.task_history(
  scheduled_time_range_start=>dateadd('hour',-24,current_timestamp()),
  result_limit => 100,
  task_name=>'t02_insert_sample')))
union
(select *
from table(
  information_schema.task_history(
  scheduled_time_range_start=>dateadd('hour',-24,current_timestamp()),
  result_limit => 100,
  task_name=>'t03_ctas_agg')))
union
(select *
from table(
  information_schema.task_history(
  scheduled_time_range_start=>dateadd('hour',-24,current_timestamp()),
  result_limit => 100,
  task_name=>'t04_insert_agg')))
union
(select *
from table(
  information_schema.task_history(
  scheduled_time_range_start=>dateadd('hour',-24,current_timestamp()),
  result_limit => 100,
  task_name=>'t05_delete_sample'))))
where
  root_task_id = (select distinct root_task_id from
                  table(information_schema.task_history(
                  scheduled_time_range_start=>dateadd('hour',-24,current_timestamp()),
                  result_limit => 100,task_name=>'t01_ctas')))
group by
  task_name,
  root_task_id,
  run_id
order by
  start_time desc;


Conclusion
Be a good data engineer and turn off your tasks to prevent unnecessary metering.
--Stop the Tasks if you want to Stop Hourly Billing
alter task demo.public.t01_ctas suspend;
alter task demo.public.t02_insert_sample suspend;
alter task demo.public.t03_ctas_agg suspend;
alter task demo.public.t04_insert_agg suspend;
alter task demo.public.t05_delete_sample suspend;
Now we can see task dependencies more clearly, understand run times, and use these methods to debug dependent task code. Happy (Recursive Task Hierarchy) Querying!

One comment